

Key Takeaways:
The U.S. Spent $806 Billion on Prescription Drugs in 2024. More Than Any Other Nation. Here's What contributes to high prices, Where Responsibility lies, and What's Being Done About It.
For many Americans, the cost of a single prescription can determine whether they follow a treatment plan or go without care. High drug prices don’t just strain household budgets; they shape health outcomes, adherence, and long-term system costs.
This guide explains why U.S. prescription drug pricing is the highest in the world, the structural forces driving costs, including manufacturer pricing, patent protections, PBM opacity, insurance design, and limited price negotiation, how those costs affect patients and families, and what recent policy changes are beginning to shift the landscape.
$806B in U.S. drug spending, 2024 (ASHP) [1]
Prices ~2.78x higher than peer nations (RAND) [3]
82% of adults say drug costs are unreasonable (KFF) [5]
By the end, you’ll have a clear, data-driven understanding of what drives prescription drug costs and how policy, coverage, and system design influence what patients ultimately pay.
Overview of Prescription Drug Spending in the United States
Prescription drug spending in the United States continues to rise at a pace that outstrips many other areas of healthcare. In 2024, total U.S. pharmaceutical expenditures reached $805.9 billion, a 10.2% increase from 2023, according to a 2025 analysis published by the American Society of Health-System Pharmacists (ASHP), underscoring both the scale and acceleration of drug spending [1].
Looking specifically at retail medications, Americans spent approximately $406 billion on prescription drugs (net of rebates) in 2022, reflecting the direct cost burden experienced by patients and payers [2].
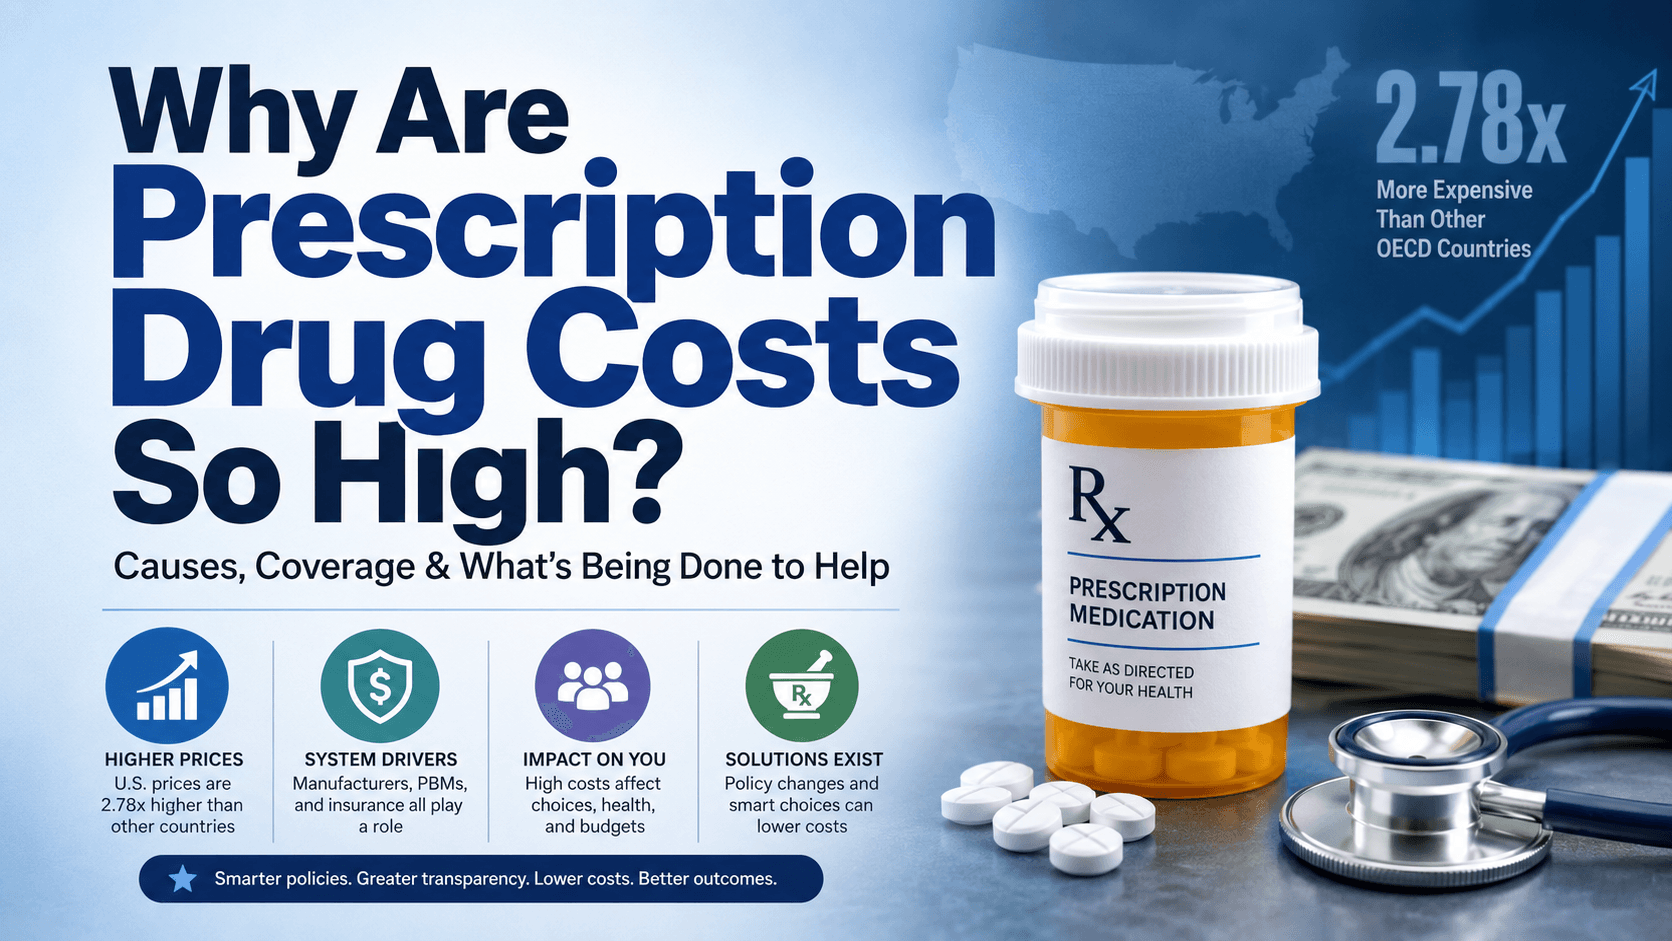
International comparisons highlight how unusual U.S. pricing is. A 2024 RAND Corporation analysis, conducted for HHS's Office of the Assistant Secretary for Planning and Evaluation (ASPE), found that U.S. prescription drug prices are, on average, 2.78 times higher than those in 33 other OECD countries in 2022. The gap was even wider for brand-name drugs, where U.S. prices ran 4.22 times higher than peer nations [3].
Prescription Drug Spending by Payer (2022)
Payer | Share of Retail Drug Spending |
Private Insurance | 38% |
Medicare | Significant and growing share |
Medicaid | Major payer for low-income populations |
Out-of-Pocket | Direct patient spending |
Private health insurance financed 38% of total retail drug spending in 2022 [2], with the remainder split across public programs and patient out-of-pocket payments. For a deeper look at how rising drug prices affect households, see Mosaic’s analysis of The Burden of High Drug Prices.
Why Are Prescription Drugs So Expensive in the U.S.?
Prescription drug costs in the United States are the result of multiple, overlapping structural factors rather than a single cause. Together, these forces shape how drugs are priced, negotiated, and ultimately paid for by patients.
Public concern reflects this reality: 82% of adults say prescription drug costs are unreasonable, and the public identifies pharmaceutical company profits as the largest factor driving those prices, according to KFF polling [5][6].
Wholesale Acquisition Cost (WAC) is the manufacturer’s list price for a drug before any discounts, rebates, or negotiated reductions. It serves as the baseline for pricing across the supply chain, even though most payers do not ultimately pay this full amount, making it a key driver of downstream costs.
Key Drivers of High Prescription Drug Costs
Driver | Explanation |
Manufacturer Pricing Power | Drug manufacturers set initial list prices, often launching new drugs at high price points with annual increases of 6–10%. |
Patent Protections | “Patent thickets” extend exclusivity periods, delaying generic and biosimilar competition and keeping prices high. |
PBM and Rebate Opacity | Pharmacy benefit managers (PBMs) negotiate rebates that reduce net costs for insurers but often do not lower patient out-of-pocket expenses. |
Insurance Benefit Design | Coinsurance tied to list prices exposes patients to higher costs, especially for specialty drugs. |
Limited Price Negotiation | Historically, Medicare was prohibited from negotiating drug prices, limiting downward pressure on costs. |
Manufacturer Pricing and Launch Strategies
Manufacturers play the central role in setting drug prices. Unlike most markets, prices are not strictly tied to production costs but to what the market will bear, including clinical value, competition, and payer willingness to cover a drug.
Launch prices for new therapies, especially specialty and biologic drugs, have risen sharply, establishing a high baseline that influences pricing across the system.
Patent Protections and Delayed Competition
Patent protections are designed to reward innovation, but they can also delay competition.
A common strategy involves creating “patent thickets,” where multiple overlapping patents extend exclusivity well beyond the original approval period. This delays the entry of lower-cost generics and biosimilars, allowing manufacturers to maintain high prices for longer.
PBMs, Rebates, and Pricing Opacity
Pharmacy benefit managers (PBMs) act as intermediaries between manufacturers, insurers, and pharmacies.
They negotiate rebates in exchange for favorable formulary placement, which can lower net costs for insurers. However, because patient cost-sharing is often based on the list price (WAC) rather than the discounted price, these savings do not always reach consumers.
This system creates a disconnect between what drugs cost the system and what patients pay at the pharmacy.
Insurance Design and Cost-Sharing
Insurance design plays a major role in determining patient out-of-pocket costs.
Many plans require:
This means that even insured patients can face significant financial exposure, particularly for specialty medications.
Limited Price Negotiation (Historically)
Unlike most developed countries, the United States has historically lacked centralized price negotiation for prescription drugs.
Until recent policy changes, Medicare, the largest purchaser of healthcare, was not allowed to negotiate drug prices directly. This limited the government’s ability to exert downward pressure on pricing across the market.
Recent reforms have begun to change this dynamic, but their full impact will take time to materialize.
What Roles Do Manufacturers and Pricing Strategies Have in Prescription Costs?
Pharmaceutical manufacturers play a central role in setting prescription drug prices, particularly through launch pricing and annual increases. The industry has historically invested heavily in research and development (R&D) relative to other sectors: a 2019 NAIC analysis found pharmaceutical manufacturers accounted for more than 16% of total U.S. R&D spending, compared to just 0.4% for health services, based on 2013 National Science Foundation data [7]. Public perception reflects this scrutiny that comes with that scale: more than three-quarters 75% of adults, across party lines, say pharmaceutical company profits are a “major factor” in drug pricing, according to KFF polling [5].
Recent trends point to a sustained rise in launch prices and ongoing pricing pressure. The American Hospital Association highlights a three-part pattern: rising overall prices, record-high launch prices, and recurring drug shortages [8]. At the same time, external scrutiny can influence pricing decisions. For example, Eli Lilly cut the list price of its branded insulin, Humalog, by 70% in 2023 and introduced a new unbranded insulin, Insulin Lispro, at a $25-per-vial list price, following years of public and policy pressure over insulin affordability [3].
Spending growth is increasingly driven by specialty medications. Drugs like semaglutide (Ozempic, Wegovy, Rybelsus) saw U.S. sales rise dramatically between 2021 and 2023, becoming one of the top-selling drugs in 2024 alongside tirzepatide and adalimumab [1][3]. These therapies often carry high list prices due to complexity, demand, and limited competition.
A key structural factor is the use of patent thickets, which refer to a web of overlapping patents filed on a single drug that collectively delay generic or biosimilar competitors from entering the market, even after the original patent expires.
What Is the Impact of Pharmacy Benefit Managers and Rebates on Drug Costs?
Pharmacy Benefit Managers play a powerful but often opaque role in the prescription drug pricing system.
PBMs are intermediaries that negotiate drug prices and rebates between manufacturers and health plans, manage formularies, and process prescription claims. Their decisions directly influence which drugs patients can access and how much they pay.
One of the most important dynamics in this system is the rebate paradox. While rebates reduce net costs for insurers and government programs, they often do not reduce what patients pay at the pharmacy counter.
For example, Medicaid rebates reduced gross drug spending by 52.8% in FY2021, according to MACPAC (the Medicaid and CHIP Payment and Access Commission). However, because patient cost-sharing such as coinsurance is typically based on a drug’s list price and not its discounted price, patients may still face high out-of-pocket costs even when substantial rebates are applied [4].
How the Drug Pricing Flow Works
This structure helps explain why lower net prices do not always translate into lower patient costs.
Regulators are increasingly scrutinizing this system. In September 2024, the Federal Trade Commission (FTC) enforcement actions targeted large PBM firms that manipulate drug pricing, signaling growing attention to PBM practices and potential reform efforts [3].
For more on policy proposals, see Mosaic’s analysis: Pharmacy Benefits Manager Reforms: Can Congress Fix the Market Without Breaking It?
How Do Insurance Plans Affect Prescription Drug Costs?
The type of insurance coverage a person has, whether Medicare, Medicaid, employer-sponsored insurance, or supplemental coverage, plays a major role in determining what they pay for prescription drugs.
Many consumers prioritize monthly premiums over potential out-of-pocket costs when selecting plans [2]. As a result, they may choose plans with lower premiums but higher deductibles, coinsurance, or formulary restrictions, which leads to greater financial exposure later.
Plans also manage costs in ways that are not always visible upfront:
This creates a shift where costs are controlled at the plan level but transferred to patients at the point of care.
The following sections break down how this plays out across major coverage types.
Medicare Part D Coverage and Cost-Sharing
Medicare Part D is the federal program that provides outpatient prescription drug coverage to Medicare beneficiaries through private insurance plans.
Part D plans typically include:
Recent reforms under the Inflation Reduction Act (IRA) have significantly changed the landscape. The law introduced an annual out-of-pocket cap on Part D drug costs, which took effect at $2,000 in 2025 and rose to $2,100 in 2026, along with eliminating the prior “donut hole” coverage gap phase entirely.
Additionally, Medicare has begun negotiating prices directly with manufacturers for select high-cost drugs. The first round of negotiated prices took effect in January 2026, with discounts ranging from 38% to 79% off 2023 list prices, and CMS projects $6 billion in Medicare savings and $1.5 billion in beneficiary out-of-pocket savings in the first year [9].
However, affordability challenges remain, particularly for middle-income beneficiaries, who often do not qualify for subsidies but still face substantial drug costs [9].
Explore projected savings using Mosaic’s Negotiation Outcomes Calculator.
Medicaid and Medicare Savings Programs Support
Medicaid provides prescription drug coverage with minimal cost-sharing for eligible low-income individuals, making it one of the most protective forms of coverage in the system.
The program is also a major negotiator. Medicaid rebates represented 52.8% of gross drug spending in FY2021, according to MACPAC, significantly lowering net costs for the program [2].
Additional support programs include:
Many low-income individuals are automatically enrolled in these programs if they qualify.
However, gaps persist. Individuals with incomes just above eligibility thresholds may not qualify for assistance, leaving them exposed to high out-of-pocket costs despite having insurance.
Employer-Sponsored Insurance and Other Supplemental Plans
Employer-sponsored insurance (ESI) covers the majority of working-age Americans but has shifted toward higher patient cost-sharing over time.
Key trends include:
This shift has important implications.
Copay vs. Coinsurance
Cost Type | How It Works | Impact on Patients |
Copay | Fixed dollar amount per prescription | Predictable costs |
Coinsurance | Percentage of drug’s list price | Costs rise as prices increase |
Because coinsurance is typically based on a drug’s list price, not its discounted price, patients may pay significantly more even when insurers receive rebates [4].
Supplemental coverage such as Medigap, retiree drug benefits, or tribal health programs can help offset some costs. The concept of creditable coverage is also important, as it allows individuals to avoid late enrollment penalties when transitioning to Medicare Part D.
What Do High Drug Costs Mean for Overall Healthcare and Affordability?
High prescription drug costs translate directly into real-world health and financial consequences for patients.
About 4 in 10 adults (43%) report not taking medications as prescribed due to cost, and 37% of people taking four or more prescriptions say they struggle to afford them, according to KFF polling [5]. These affordability pressures are widespread: 66% of U.S. adults currently take at least one prescription medication, making drug costs a near-universal concern [5].
The clinical consequences are significant. Patients frequently delay or skip medications, which can worsen chronic conditions and lead to more expensive interventions later. Providers increasingly report spending time helping patients navigate costs rather than focusing solely on treatment decisions[9].
Middle-income patients face a growing gap: too high to qualify for subsidies, but still vulnerable to high out-of-pocket drug costs[9]
This dynamic, high prices paired with uneven financial protections, drives both medication non-adherence and broader healthcare spending, as untreated conditions escalate into more costly care.
For more on how drug costs affect households, see West Health and Gallup’s findings in The Burden of High Drug Prices and In U.S., Inability to Pay for Care, Medicine Hits New High.
Recent Policy Efforts and Their Impact on Drug Prices
Policymakers have taken several steps in recent years to address rising prescription drug costs, with the Inflation Reduction Act representing the most significant federal reform to date.
Key provisions include:
These changes mark a shift toward greater federal involvement in drug pricing. However, their scope remains limited. Current negotiation authority applies only to a small number of drugs and primarily benefits Medicare enrollees.
Additional policy efforts are focused on transparency and oversight:
Key Policy Milestones
While these reforms represent meaningful progress, many experts argue that broader application across private markets and additional drug categories will be necessary to significantly reduce overall drug costs.
For more on policy advocacy, see Mosaic’s perspective: Americans Are Dying Over Drug Costs: It’s Time to Let Medicare Negotiate Prices.
Market Trends Driving Future Prescription Drug Spending
Looking ahead, several structural trends are expected to drive continued growth in prescription drug spending.
Overall drug spending is projected to increase 9.0% to 11.0% in 2025, with even higher growth in clinical settings such as hospitals and infusion centers [1].
One of the most significant drivers is the rapid rise of GLP-1 medications. Drugs like semaglutide (Ozempic, Wegovy, Rybelsus) saw U.S. sales increase dramatically between 2021 and 2023, and semaglutide was the top drug by total spending in 2024 [1]. These therapies are reshaping both payer budgets and long-term cost projections.
At the same time, the broader market shows a split dynamic:
Another emerging concern is drug shortages, which can increase prices and limit access. The American Hospital Association has warned that shortages, combined with rising prices, create additional strain on both providers and patients [8].
Together, these trends suggest that while policy reforms may slow growth in certain areas, specialty drug demand, innovation, and supply constraints will continue to drive upward pressure on prescription drug spending.
How to Lower Prescription Drug Costs
While many factors driving prescription drug costs are systemic, there are several practical steps individuals can take to reduce their out-of-pocket expenses.
Actionable strategies to lower prescription drug costs:
Frequently Asked Questions
Why do prescription drug prices vary so much between pharmacies?
Pharmacies negotiate different prices with wholesalers and PBMs, and their dispensing fees vary. Using discount cards or comparing prices across pharmacies, including mail-order options, can reveal savings of up to several hundred percent on the same medication.
How does coinsurance differ from copayments in prescription drug plans?
A copayment is a fixed dollar amount you pay per prescription (e.g., $20), while coinsurance is a percentage of the drug’s price, which is often based on the list price before rebates. This means coinsurance costs increase as drug prices rise.
What financial assistance programs exist for people struggling to afford medications?
Programs include Medicare’s Extra Help (Low-Income Subsidy), state pharmaceutical assistance programs, manufacturer patient assistance programs, and nonprofit foundations. These can significantly reduce or eliminate out-of-pocket costs for eligible individuals.
How can switching to generic drugs lower my out-of-pocket costs?
Generic drugs contain the same active ingredients as brand-name medications but typically cost 80% to 85% less, according to FDA estimates. Because generics and biosimilars make up about 90% of prescriptions filled, switching is one of the most effective ways to reduce drug spending.
What should patients know about formularies and utilization management?
A formulary is your plan’s list of covered drugs, organized into tiers that determine your cost-sharing. Utilization management tools, such as prior authorization, step therapy, and quantity limits, control access to certain medications. Reviewing your formulary before enrollment can help avoid unexpected costs.
Citation
West Health Mosaic. Prescription Drug Costs: Plans, Coverage, & Other Price-Driving Factors. Published: July 27, 2026
Additional Resources
https://westhealthmosaic.com/articles/the-burden-of-high-drug-prices
https://westhealthmosaic.com/articles/the-burden-of-prescription-drug-prices-on-seniors
https://westhealthmosaic.com/articles/reducing-the-high-price-of-prescription-medicines
https://westhealthmosaic.com/articles/prescription-drug-affordability-in-america-a-growing-crisis
https://westhealthmosaic.com/articles/two-ways-to-reduce-prescription-drug-costs
https://westhealthmosaic.com/data-mosaics/negotiation-outcomes-calculator
https://westhealthmosaic.com/articles/how-much-can-pharma-lose
https://westhealthmosaic.com/articles/americans-support-government-action-on-high-drug-prices
https://westhealthmosaic.com/articles/the-case-for-lower-drug-prices-for-all-americans
Notes
[1] pubmed.ncbi.nlm.nih.gov. Pharmaceutical Expenditures and Drug Trends. https://pubmed.ncbi.nlm.nih.gov/40263109/
[2] aspe.hhs.gov. National Summary of Prescription Drug Spending. https://aspe.hhs.gov/sites/default/files/documents/2380bb90071b49b6a09ee61d0f79d978/nsa-drug-pricing-rtc.pdf
[3] med.stanford.edu. Policy Options White Paper on Drug Pricing. https://medicine.stanford.edu/news/stories/2024/10/policy-options-white-paper.html
[4] www.dol.gov. 2024 Report to Congress on Prescription Drug Spending. https://www.dol.gov/sites/dolgov/files/ebsa/laws-and-regulations/laws/no-surprises-act/2024-report-to-congress-prescription-drug-spending.pdf
[5] www.kff.org. Public Opinion on Prescription Drugs and Their Prices. https://www.kff.org/health-costs/public-opinion-on-prescription-drugs-and-their-prices/
[6] www.kff.org. Public Views on Prescription Drug Costs, Regulation, Affordability, and TrumpRx. https://www.kff.org/public-opinion/public-views-on-prescription-drug-costs-regulation-affordability-and-trumprx/
[7] content.naic.org. Healthcare Cost Drivers Installment 2: Pharmaceutical and Healthcare Service Costs. https://content.naic.org/sites/default/files/inline-files/cipr_topic_healthcare_cost_drivers_cost_drivers_installment_2.pdf
[8] www.aha.org. Drug Prices and Shortages Jeopardize Patient Access & Quality Hospital Care. https://www.aha.org/news/blog/2024-05-22-drug-prices-and-shortages-jeopardize-patient-access-quality-hospital-care
[9] www.commonwealthfund.org. Drug Costs and Their Impact: Care Insights for Medicare Patients & Providers. https://www.commonwealthfund.org/publications/issue-briefs/2025/feb/drug-costs-impact-care-insights-medicare-patients-providers
[10] https://westhealth.org. Making Prescription Drugs Affordable. https://westhealth.org/initiatives/making-prescription-drugs-affordable/
[11] news.gallup.com. In U.S., Inability to Pay for Care, Medicine Hits New High. https://news.gallup.com/poll/658148/inability-pay-care-medicine-hits-new-high.aspx