indicator
Residents/Beds
Residents/Beds
Description
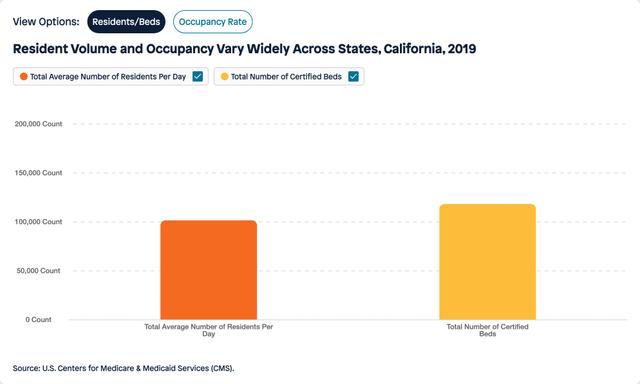
Occupancy, 2019 (Residents/Beds)
Data Source
Nursing Homes Including Rehab Services (NHIRS)
Calculation Methodology
- 1From the CMS Provider Information dataset, read monthly provider information files and extract the state column (
STATE), the average residents column (RESTOT), and the certified beds column (BEDCERT) for each facility record. Exclude records where state is AS, GU, MP, PR, or VI. Coerce capacity columns to numeric, treating non-parseable entries as missing. - 2Sum total average residents per day and total certified beds by state for each month.
- 3Calculate the yearly mean of monthly totals per state to produce annualized sums for both metrics.
Source Variables using this Indicator (3)
Visuals Using This Indicator (1)
Occupancy, 2019 (Residents/Beds)
View visualizationWhy This Matters
Transparent methodology ensures every insight can be traced, verified, and built upon.
Reproducible Research
Every calculation can be traced back to its source. Our methodology documentation enables researchers to replicate findings and build upon our work.
Accountability
Clear attribution and citation requirements ensure proper credit to data providers and maintain research integrity.
Continuous Improvement
Transparent documentation allows for peer review, feedback, and iterative improvements to our analytical approaches.