indicator
Race & Ethnicity
Race & Ethnicity
Description
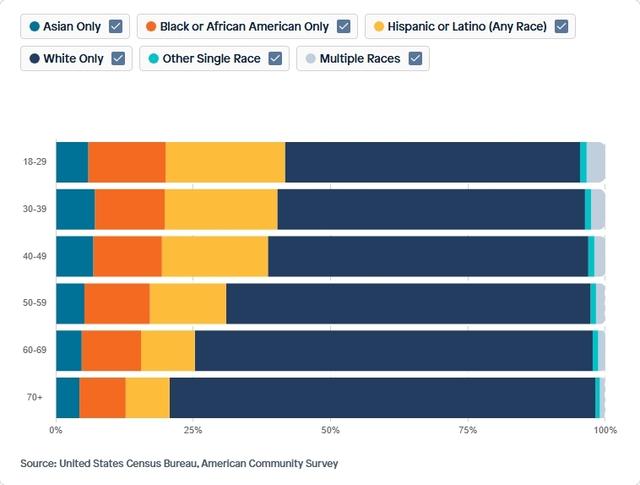
Share of Population by Age and Self-Reported Race and Ethnicity, 2019
Data Source
American Community Survey (ACS)
Calculation Methodology
- 1Select individuals aged 18 and older using the
AGEPcolumn with a filter conditionAGEP >= 18. - 2Derive age groups from the
AGEPcolumn by binning into six categories: 18-29, 30-39, 40-49, 50-59, 60-69, and 70+, corresponding to the ranges 18-29.99, 30-39.99, 40-49.99, 50-59.99, 60-69.99, and 70+ respectively. - 3Use the
RAC1PandHISPcolumns to classify race and ethnicity according to specified conditions, such as Asian Only, Black or African American Only, White Only, Hispanic or Latino (Any Race), Other Single Race, and Multiple Races. - 4Apply the weight column
weightto all records to ensure weighted population estimates. - 5Aggregate the weighted counts by the derived age groups and race/ethnicity categories to calculate the share of the population within each group.
- 6Present the results in a stacked bar chart format showing the distribution of race and ethnicity shares across the six age groups.
Source Variables using this Indicator (16)
Visuals Using This Indicator (1)
Share of Population by Age and Self-Reported Race and Ethnicity, 2019
View visualizationWhy This Matters
Transparent methodology ensures every insight can be traced, verified, and built upon.
Reproducible Research
Every calculation can be traced back to its source. Our methodology documentation enables researchers to replicate findings and build upon our work.
Accountability
Clear attribution and citation requirements ensure proper credit to data providers and maintain research integrity.
Continuous Improvement
Transparent documentation allows for peer review, feedback, and iterative improvements to our analytical approaches.