indicator
Poverty Level
Poverty Level
Description
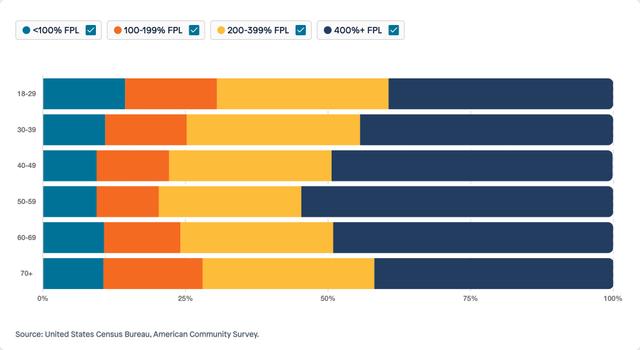
Share of Population by Federal Poverty Level (FPL), by Age, 2024
Data Source
American Community Survey (ACS)
Calculation Methodology
- 1Select records from the dataset where
AGEPis 18 or older. - 2Derive age groups from the
AGEPcolumn using these bins: 18-29, 30-39, 40-49, 50-59, 60-69, and 70+. - 3Use the
FEDERAL_POVERTY_LEVELScolumn to classify individuals into poverty categories: <100% FPL, 100-199% FPL, 200-399% FPL, and 400%+ FPL. - 4Apply the weight column
PWGTPto each record to adjust for survey sampling. - 5Aggregate weighted counts by
AGEP-based age groups andFEDERAL_POVERTY_LEVELScategories. - 6Calculate the share of the population within each poverty level category for each age group.
Source Variables using this Indicator (16)
Visuals Using This Indicator (1)
Share of Population by Federal Poverty Level (FPL), by Age, 2024
View visualizationWhy This Matters
Transparent methodology ensures every insight can be traced, verified, and built upon.
Reproducible Research
Every calculation can be traced back to its source. Our methodology documentation enables researchers to replicate findings and build upon our work.
Accountability
Clear attribution and citation requirements ensure proper credit to data providers and maintain research integrity.
Continuous Improvement
Transparent documentation allows for peer review, feedback, and iterative improvements to our analytical approaches.