indicator
Income Sources
Income Sources
Description
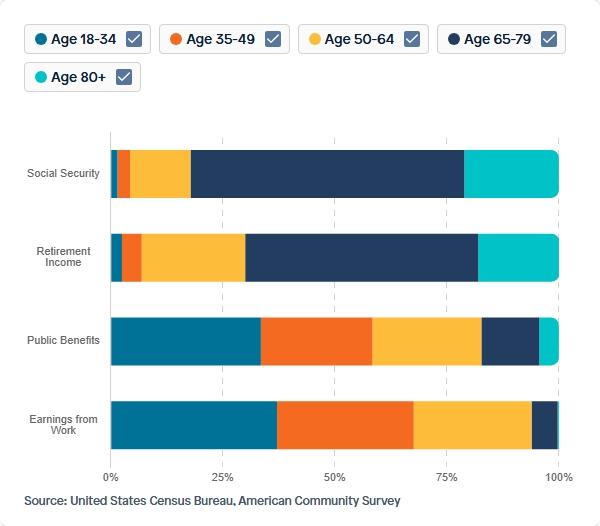
Age Distribution of Various Types of Income Sources, 2020
Data Source
American Community Survey (ACS)
Calculation Methodology
- 1Select records from the dataset using the columns
AGEP,RAC1P,HISP,SEX,POVPIP,LANX,CIT,MAR,SCHL,DIS,FS,TYPEHUGQ,SSP,RETP, andWAGP. - 2Derive age groups from the
AGEPcolumn by binning ages into ranges: 18-34, 35-49, 50-64, 65-79, and 80+, corresponding to labels Age 18-34, Age 35-49, Age 50-64, Age 65-79, and Age 80+. - 3Filter the dataset for each income source category using the following conditions: Public Benefits where
FS=1andTYPEHUGQ=1; Social Security whereSSP>0; Retirement Income whereRETP>0; and Earnings from Work whereWAGP>0. - 4Apply the person weight column
PWGTPto weight each record in the dataset. - 5Aggregate the weighted counts by the derived age groups from
AGEPto calculate the share of individuals receiving each income source. - 6Present the results as a stacked bar chart showing the distribution of income sources across the age groups.
Source Variables using this Indicator (24)
Visuals Using This Indicator (1)
Age Distribution of Various Types of Income Sources, 2020
View visualizationWhy This Matters
Transparent methodology ensures every insight can be traced, verified, and built upon.
Reproducible Research
Every calculation can be traced back to its source. Our methodology documentation enables researchers to replicate findings and build upon our work.
Accountability
Clear attribution and citation requirements ensure proper credit to data providers and maintain research integrity.
Continuous Improvement
Transparent documentation allows for peer review, feedback, and iterative improvements to our analytical approaches.