indicator
Income & Poverty
Income & Poverty
Description
Share of Householders Age 65 or Older With Income Below the Federal Poverty Level (FPL) or the Elder Index in Their Area, by Household Size and Housing Tenure, 2019
Data Source
American Community Survey (ACS)
Data Source
Elder Economic Security Standard Index (Elder Index)
Calculation Methodology
- 1Select respondents aged 65 or older using the
AGEPcolumn, where values greater than 64.99 represent this group. - 2Derive household size categories from the
NPcolumn, whereNP=1means one-person household,NP=2means two persons, andNP=3or more means three or more persons. - 3Filter respondents by housing tenure using the
TENUREcolumn, whereTENURE=1indicates owned with mortgage,TENURE=2indicates owned without mortgage, andTENURE=3indicates rented. - 4Use the
FPLcolumn to identify respondents with income below the Federal Poverty Level or the Elder Index benchmarks. - 5Apply the weight column
WEIGHTto calculate weighted shares of householders by household size and housing tenure. - 6Aggregate the weighted shares by
HOUSEHOLD_TYPEcategories to produce the grouped stacked bar chart.
Source Variables using this Indicator (13)
Visuals Using This Indicator (1)
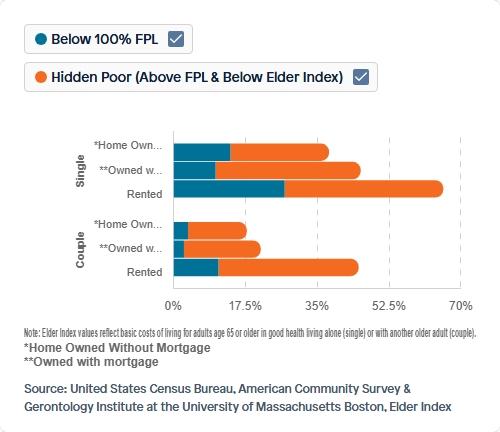
Share of Householders Age 65 or Older With Income Below the Federal Poverty Level (FPL) or the Elder Index in Their Area, by Household Size and Housing Tenure, 2019
View visualizationWhy This Matters
Transparent methodology ensures every insight can be traced, verified, and built upon.
Reproducible Research
Every calculation can be traced back to its source. Our methodology documentation enables researchers to replicate findings and build upon our work.
Accountability
Clear attribution and citation requirements ensure proper credit to data providers and maintain research integrity.
Continuous Improvement
Transparent documentation allows for peer review, feedback, and iterative improvements to our analytical approaches.