indicator
Household
Household
Description
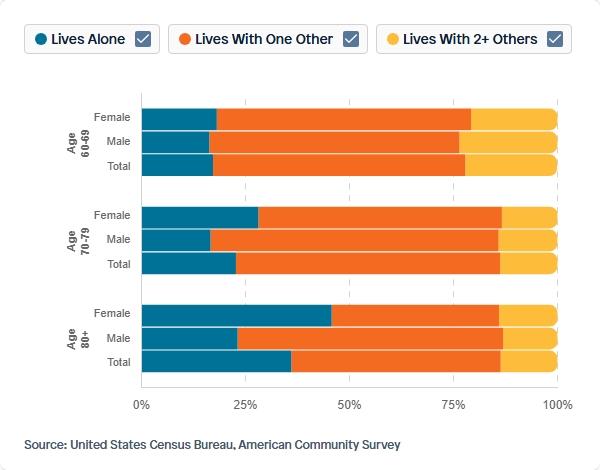
Share of Population Age 60 or Older Living Alone or With Others, by Age and Sex, 2023
Data Source
American Community Survey (ACS)
Calculation Methodology
- 1Select data from the ACS dataset using the columns
AGEP,SEX,NP,TEN, andSTATE. - 2Filter the dataset to include only households with
TENequal to '2' (indicating renter-occupied households). - 3Derive age groups from
AGEPby binning into three categories: 60-69, 70-79, and 80+, based on the specified bins. - 4Use the
SEXcolumn to separate data into Male (SEX=1), Female (SEX=2), and Total (both sexes). - 5Use the
NPcolumn to categorize household persons into Lives Alone (NP=1), Lives With One Other (NP=2), and Lives With 2+ Others (NP=3+). - 6Apply the weight column
PWGTPto calculate weighted shares of the population by age group, sex, and household person categories.
Source Variables using this Indicator (17)
Visuals Using This Indicator (1)
Share of Population Age 60 or Older Living Alone or With Others, by Age and Sex, 2023
View visualizationWhy This Matters
Transparent methodology ensures every insight can be traced, verified, and built upon.
Reproducible Research
Every calculation can be traced back to its source. Our methodology documentation enables researchers to replicate findings and build upon our work.
Accountability
Clear attribution and citation requirements ensure proper credit to data providers and maintain research integrity.
Continuous Improvement
Transparent documentation allows for peer review, feedback, and iterative improvements to our analytical approaches.