indicator
Household
Household
Description
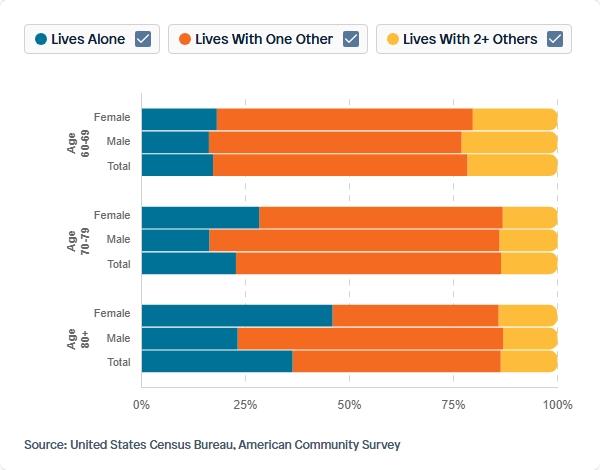
Share of Population Age 60 or Older Living Alone or With Others, by Age and Sex, 2022
Data Source
American Community Survey (ACS)
Calculation Methodology
- 1Select data from the ACS dataset using the columns
AGEP,SEX,NP,PWGTP, andST. - 2Filter households where
TENequals '2' to include only renter-occupied units. - 3Derive age groups from
AGEPby binning into Age 60-69 (AGEP60 to 69.99), Age 70-79 (AGEP70 to 79.99), and Age 80+ (AGEP80 and above). - 4Derive household persons categories from
NPby binning into Lives Alone (NP=1), Lives With One Other (NP=2), and Lives With 2+ Others (NP=3 or more). - 5Apply the person weight
PWGTPto each record to account for survey design and population representation. - 6Aggregate the weighted counts by
STand the derived age groups, then segment bySEXto produce grouped and stacked bar chart data for Female, Male, and Total populations.
Source Variables using this Indicator (17)
Visuals Using This Indicator (1)
Share of Population Age 60 or Older Living Alone or With Others, by Age and Sex, 2022
View visualizationWhy This Matters
Transparent methodology ensures every insight can be traced, verified, and built upon.
Reproducible Research
Every calculation can be traced back to its source. Our methodology documentation enables researchers to replicate findings and build upon our work.
Accountability
Clear attribution and citation requirements ensure proper credit to data providers and maintain research integrity.
Continuous Improvement
Transparent documentation allows for peer review, feedback, and iterative improvements to our analytical approaches.