indicator
Health Care Coverage
Health Care Coverage
Description
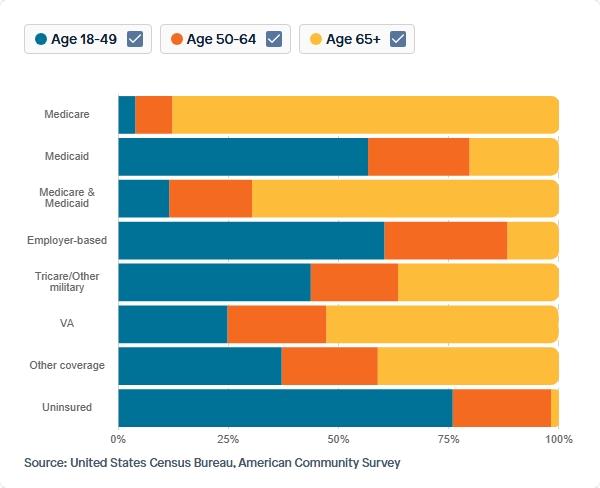
Age Distribution of Health Care Coverage Sources, 2022
Data Source
American Community Survey (ACS)
Calculation Methodology
- 1Select the columns
AGEP,HINS1,HINS3,HINS4,HINS5,HINS6,HINS7,HICOV, andSTfrom the dataset. - 2Derive age groups from
AGEPusing bins: 18-49, 50-64, and 65+, corresponding to Age 18-49, Age 50-64, and Age 65+. - 3Apply filters for each health care coverage type based on the following conditions:
HINS3=1for Medicare,HINS4=1for Medicaid, bothHINS3=1andHINS4=1for Medicare & Medicaid,HINS1=1for Employer-based,HINS5=1for Tricare/Other military,HINS6=1for VA, eitherHINS2=1orHINS7=1for Other coverage, andHICOV=2for Uninsured. - 4Use the weight column
PWGTPto weight each respondent’s data. - 5Aggregate the weighted counts by
AGEPbins to calculate the share of each health care coverage source within each age group. - 6Present the results as a stacked bar chart showing the distribution of health care coverage sources across the defined age groups.
Source Variables using this Indicator (18)
Visuals Using This Indicator (1)
Age Distribution of Health Care Coverage Sources, 2022
View visualizationWhy This Matters
Transparent methodology ensures every insight can be traced, verified, and built upon.
Reproducible Research
Every calculation can be traced back to its source. Our methodology documentation enables researchers to replicate findings and build upon our work.
Accountability
Clear attribution and citation requirements ensure proper credit to data providers and maintain research integrity.
Continuous Improvement
Transparent documentation allows for peer review, feedback, and iterative improvements to our analytical approaches.