indicator
Cognitive Difficulty by Race
Cognitive Difficulty by Race
Description
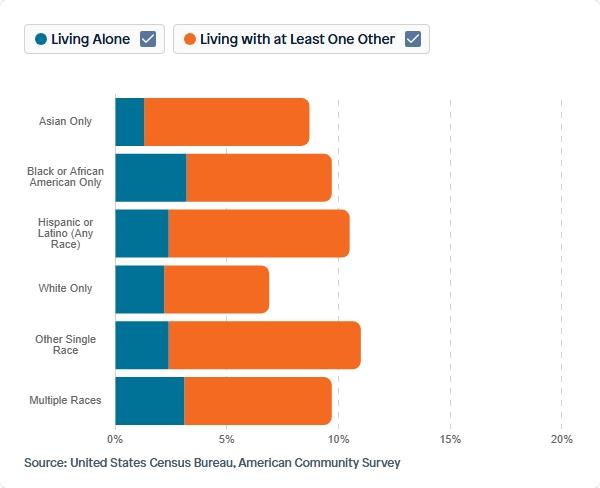
Share of Adults Age 50 or Older With Increased Confusion or Memory Loss in the Last 12 Months, by Race & Ethnicity and Whether They Have Talked with a Health Professional about the Decline, 2023
Data Source
American Community Survey (ACS)
Calculation Methodology
- 1Select respondents aged 65 or older using the
AGEPcolumn. - 2Filter data by race categories using the
RACEcolumn according to specified race codes. - 3Use the
COGNITIVE_DIFFICULTIEScolumn to identify cognitive difficulty status, excluding the Unspecified category. - 4Apply the survey weight from the
PWGTPcolumn to each respondent's data. - 5Aggregate weighted counts by
STATEand race categories to calculate the share of adults with cognitive difficulties. - 6Present results as a stacked bar chart showing cognitive difficulty by race and ethnicity across states.
Source Variables using this Indicator (19)
Visuals Using This Indicator (1)
Share of Adults Age 50 or Older With Increased Confusion or Memory Loss in the Last 12 Months, by Race & Ethnicity and Whether They Have Talked with a Health Professional about the Decline, 2023
View visualizationWhy This Matters
Transparent methodology ensures every insight can be traced, verified, and built upon.
Reproducible Research
Every calculation can be traced back to its source. Our methodology documentation enables researchers to replicate findings and build upon our work.
Accountability
Clear attribution and citation requirements ensure proper credit to data providers and maintain research integrity.
Continuous Improvement
Transparent documentation allows for peer review, feedback, and iterative improvements to our analytical approaches.