indicator
Age
Age
Description
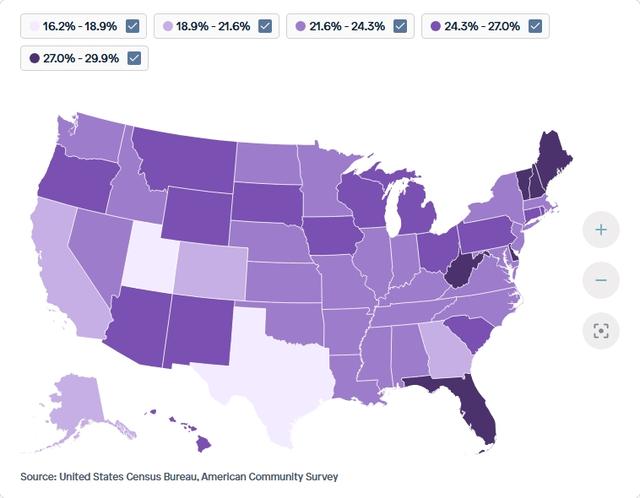
Share of Population Age 60 or Older, by State, 2023
Data Source
American Community Survey (ACS)
Calculation Methodology
- 1Select the columns
AGEP,STATE, andPWGTPfrom the dataset. - 2Derive the population aged 60 or older by categorizing
AGEPinto two bins: less than 60 and 60 or older, whereAGEPvalues 60 and above represent the 60+ group. - 3Filter the dataset to include only records where
AGEPis 60 or older. - 4Apply the person weight
PWGTPto each record to account for survey sampling design. - 5Aggregate the weighted counts by
STATEto calculate the total weighted population aged 60 or older per state. - 6Calculate the share of the population aged 60 or older in each state by dividing the weighted 60+ population by the total weighted population of all ages in that state.
Source Variables using this Indicator (14)
Visuals Using This Indicator (1)
Share of Population Age 60 or Older, by State, 2023
View visualizationWhy This Matters
Transparent methodology ensures every insight can be traced, verified, and built upon.
Reproducible Research
Every calculation can be traced back to its source. Our methodology documentation enables researchers to replicate findings and build upon our work.
Accountability
Clear attribution and citation requirements ensure proper credit to data providers and maintain research integrity.
Continuous Improvement
Transparent documentation allows for peer review, feedback, and iterative improvements to our analytical approaches.